Interpret Simulation Results Faster with New Dashboards in idoba.sim
We’ve made it even easier for you to interpret your simulation results in idoba.sim underground simulation software with two new dashboards accessible from the Simulation Report Menu.
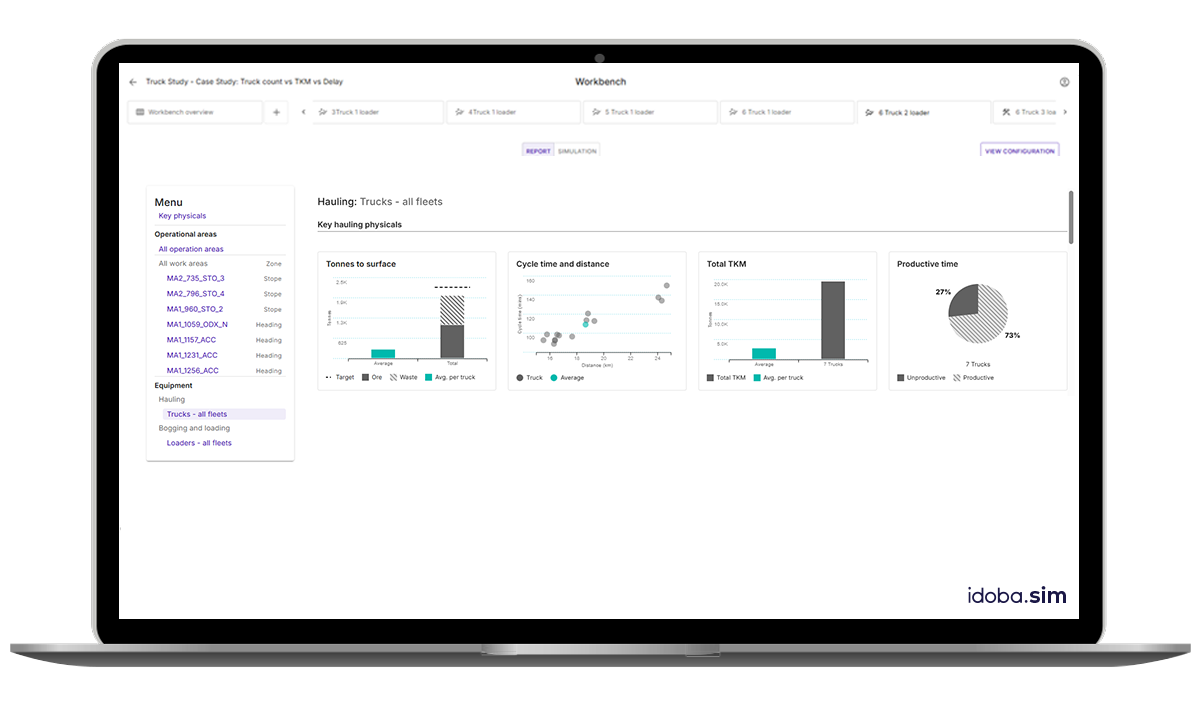
Haulage Fleet Shift Summary Dashboard
This intuitive dashboard includes four-panels focused on material movement, fleet productivity, and haulage efficiency.
Panel 1 – Tonnes to Surface
Displays average tonnes hauled per truck and total tonnes moved (ore and waste) against target values, enabling quick performance assessments against shift objectives.Panel 2 – Cycle Time & Distance
Visualises cycle times and round-trip distances for completed haul cycles, helping identify variability in haulage efficiency.Panel 3 – Tonnes-Kilometres Moved (TKM)
Provides average TKMs per truck and total TKMs for the fleet per shift, which is essential for comparing haulage productivity across scenarios.Panel 4 – Time Utilisation
Highlights operational efficiency with a pie chart contrasting productive versus unproductive time across the fleet.
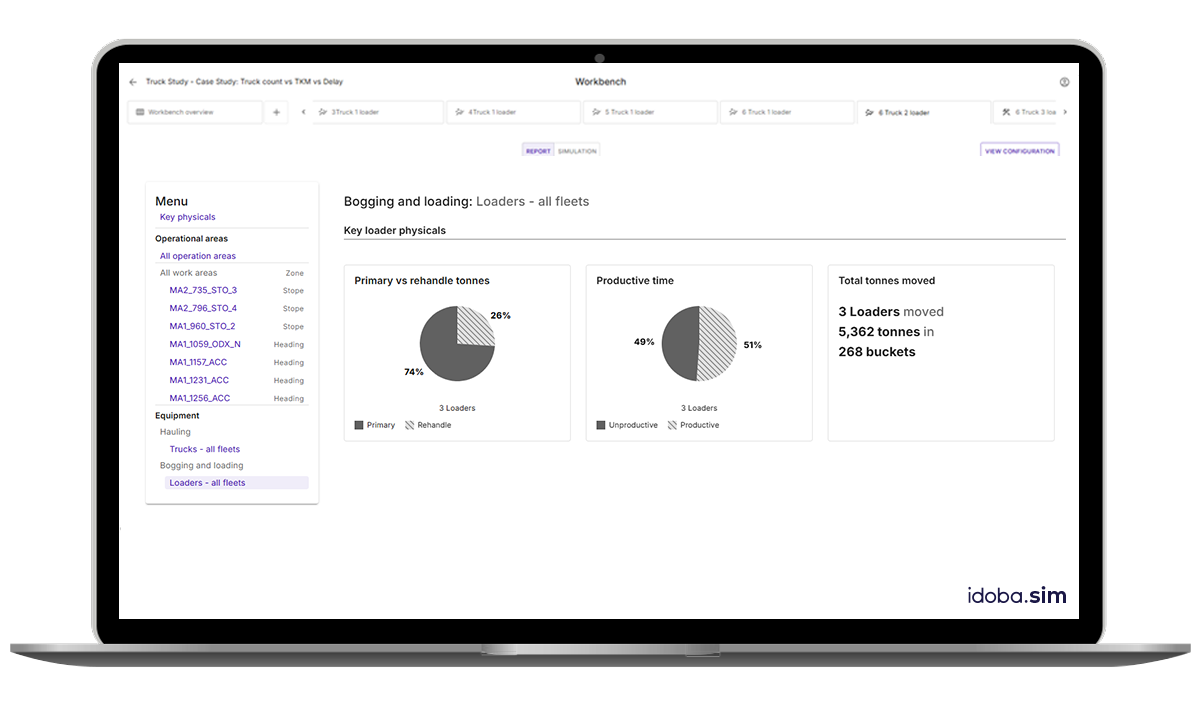
Loader Fleet Shift Summary Dashboard
Monitor your loader fleet performance efficiently with this dashboard, which helps assess loader resource effectiveness in relation to haulage performance and material flow constraints:
Panel 1 – Material Handling Distribution
Shows the proportion of time spent moving primary versus rehandled tonnes, helping identify potential inefficiencies in material flow.Panel 2 – Time Utilisation
Summarises productive versus unproductive time at the fleet level, pinpointing idle periods to support better coordination between loading and haulage activities.Panel 3 – Production Summary (Text View)
Offers a concise summary of total material moved, including the number of loaders used, total tonnes moved, and the number of loader buckets required, giving a quick quantitative snapshot of productivity.
We’re Always Listening
We are committed to continuously improving our software applications to provide you with the best possible experience. Please don’t hesitate to contact us to share your feedback and submit new feature requests.