Featured Articles
Subscribe to Our Newsletter
For the latest mining industry news, blogs, and information about our products.
Delivered to your inbox each month.
More Resources
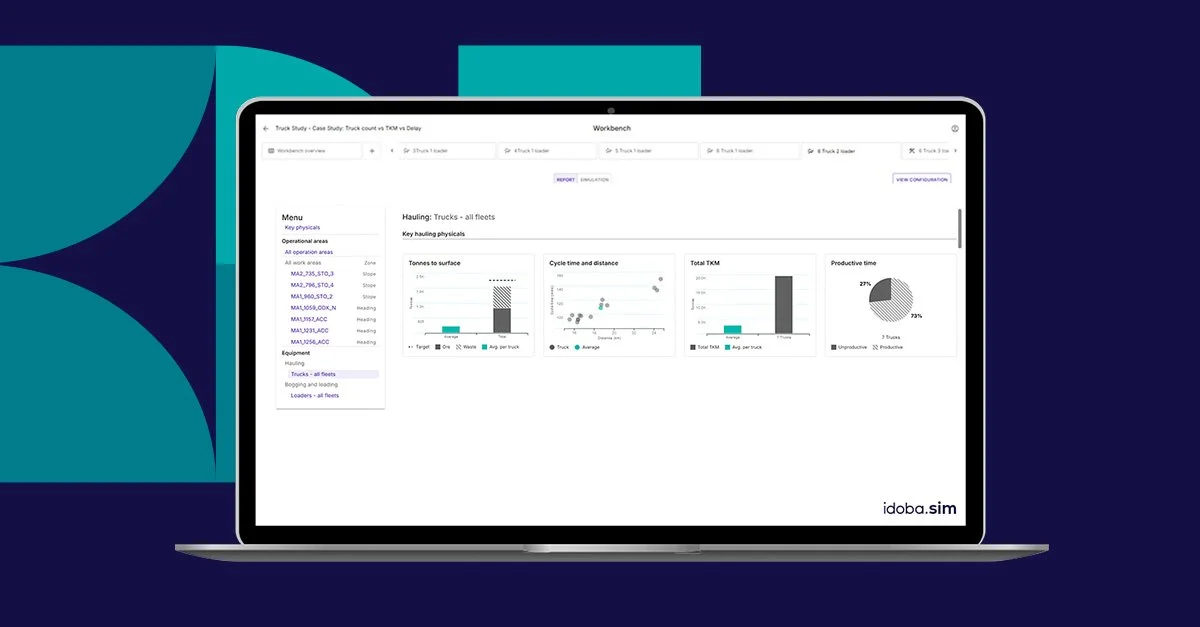
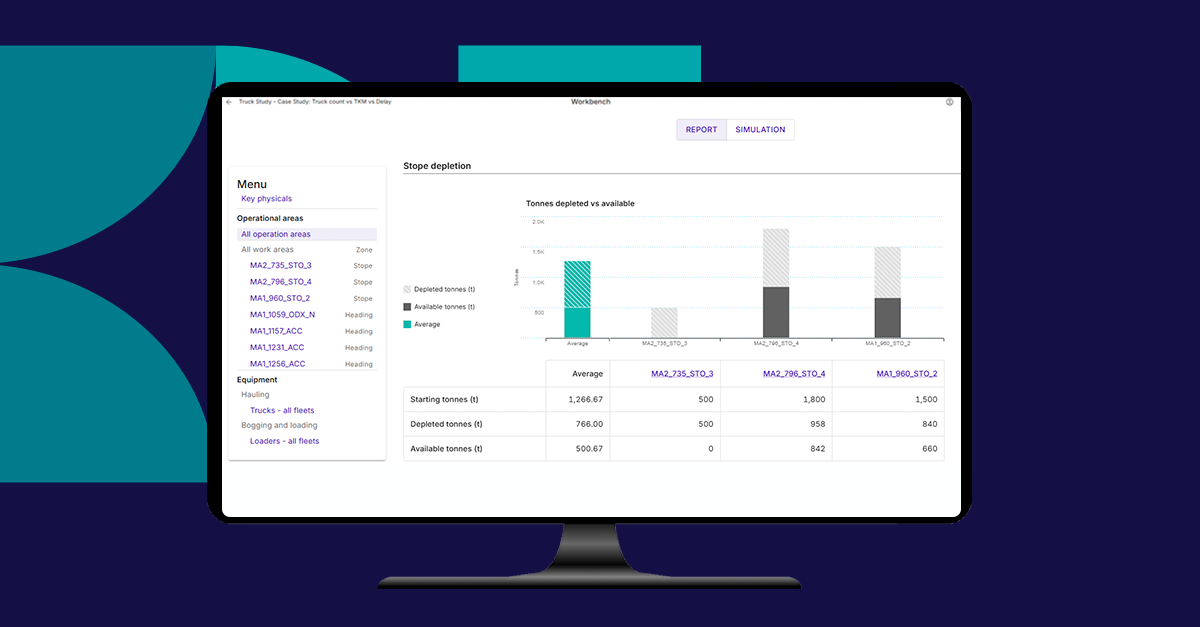
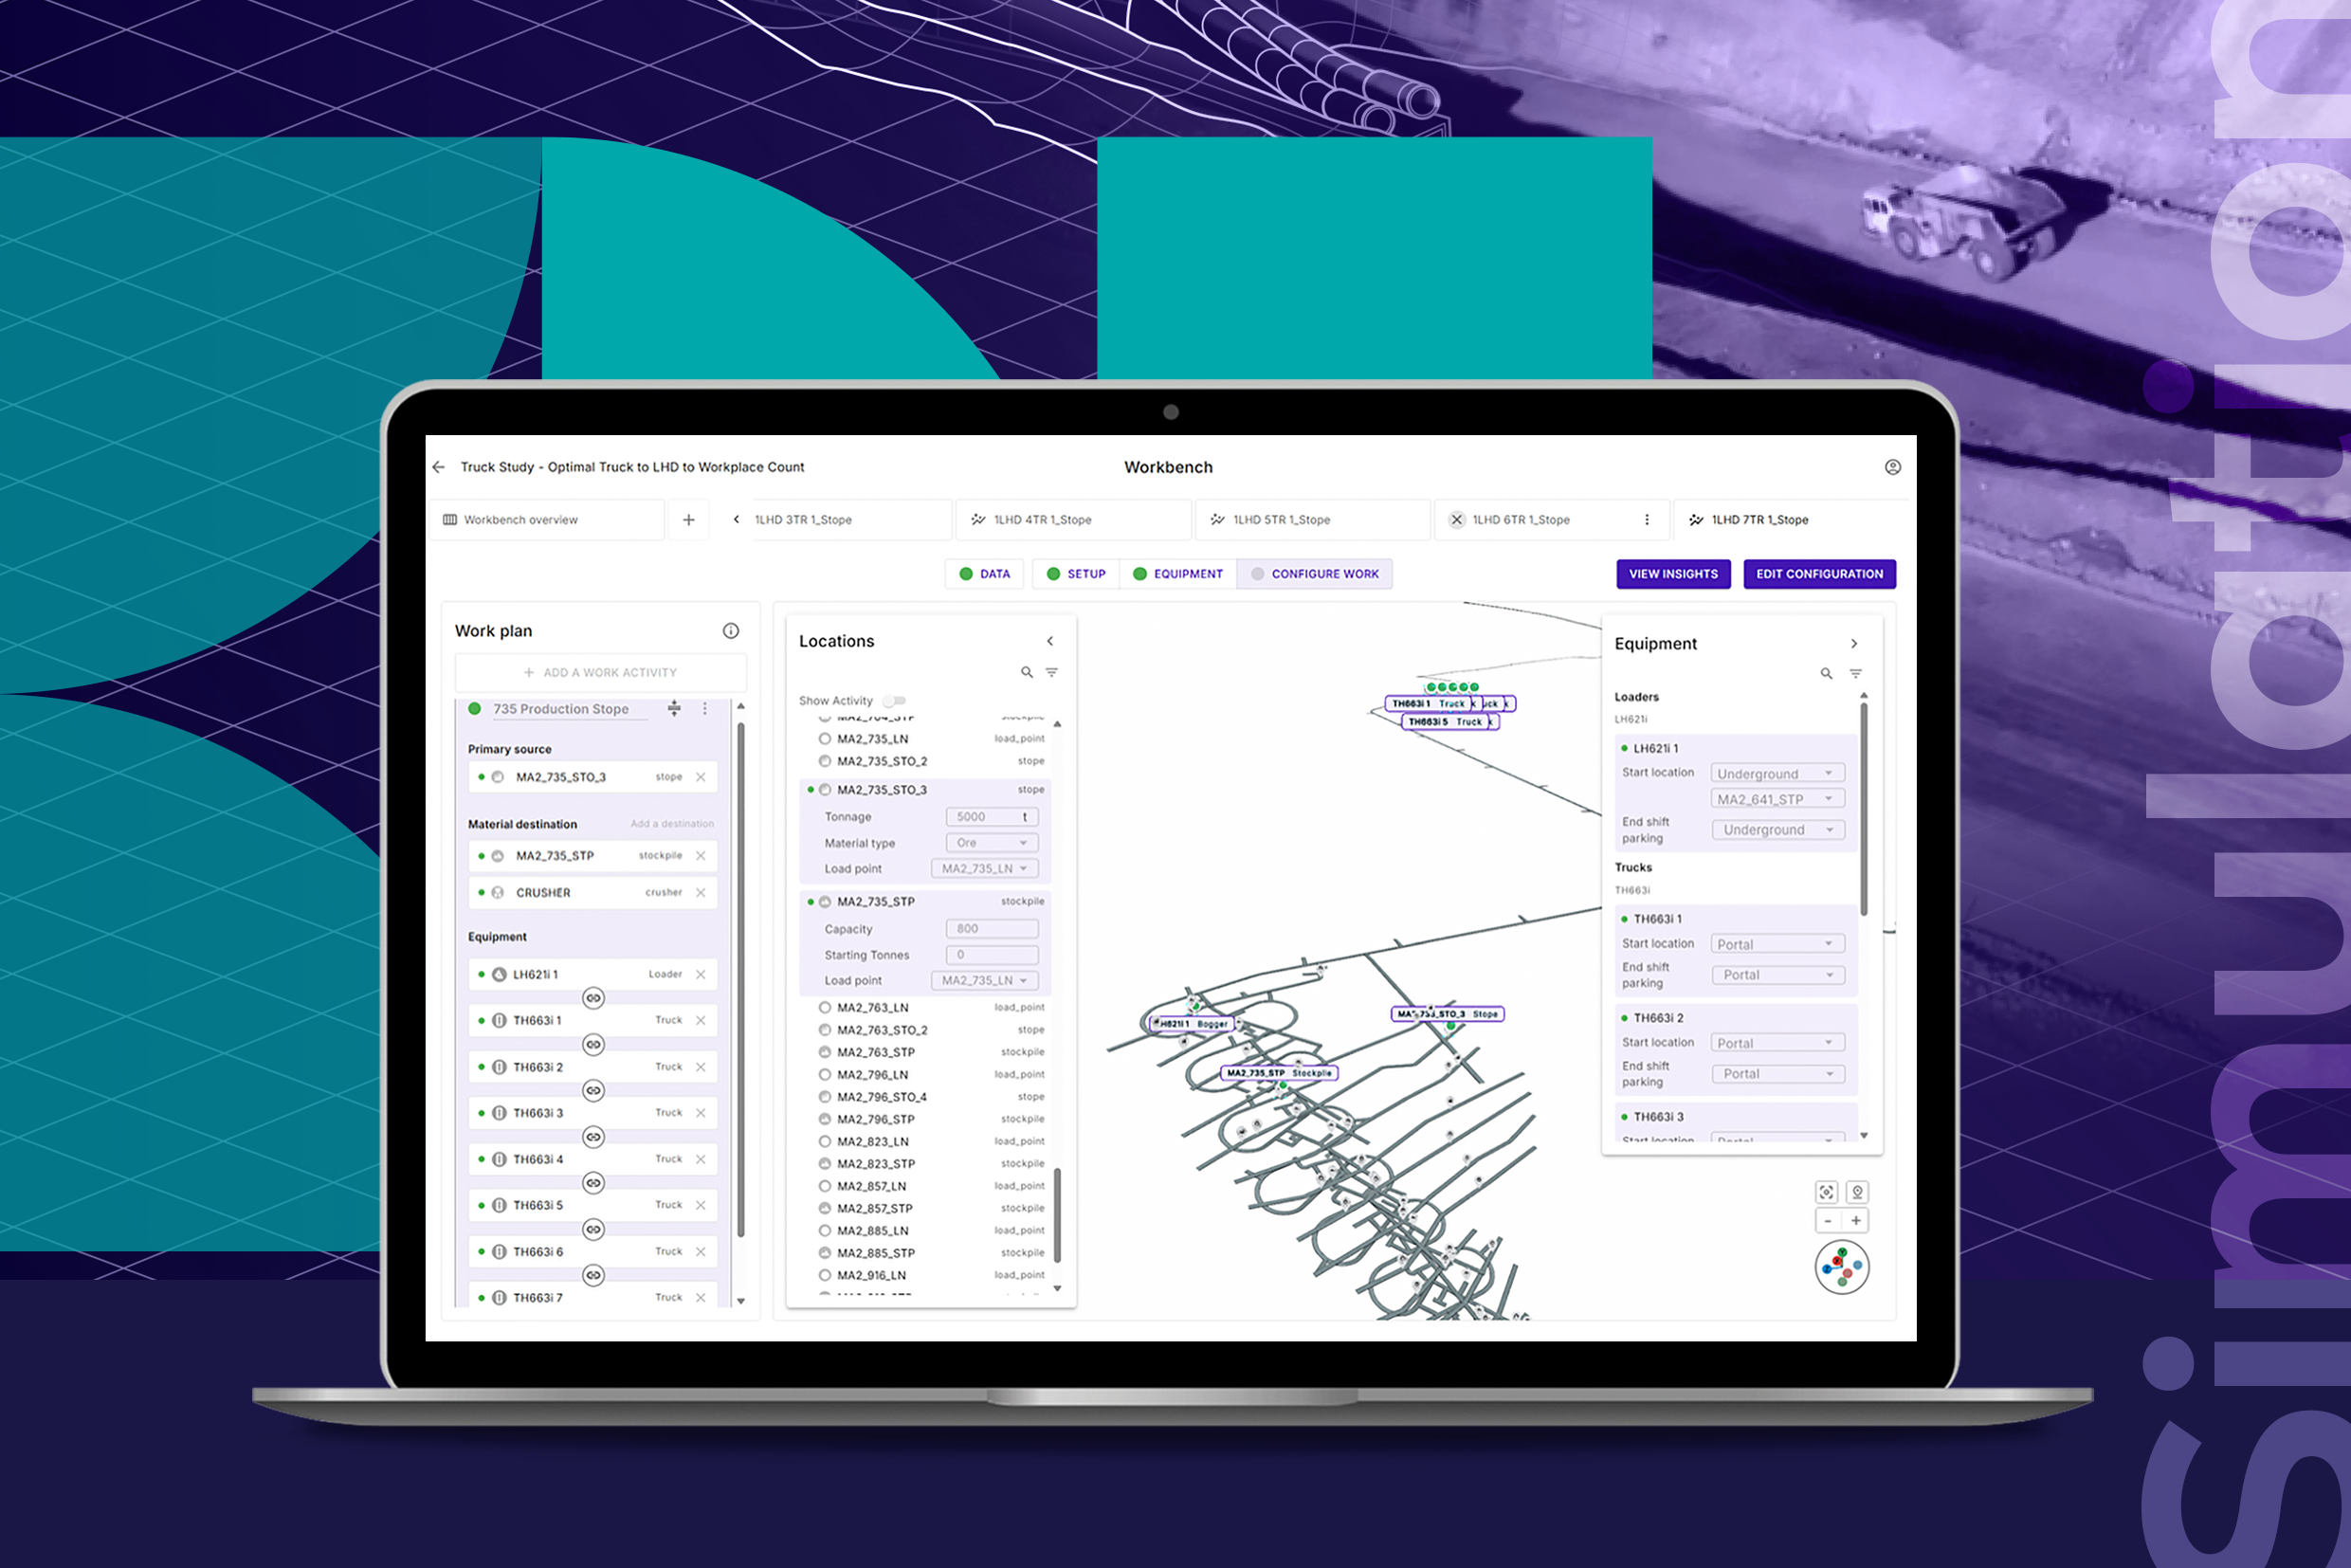
Interpret Simulation Results Faster with New Dashboards in idoba.sim
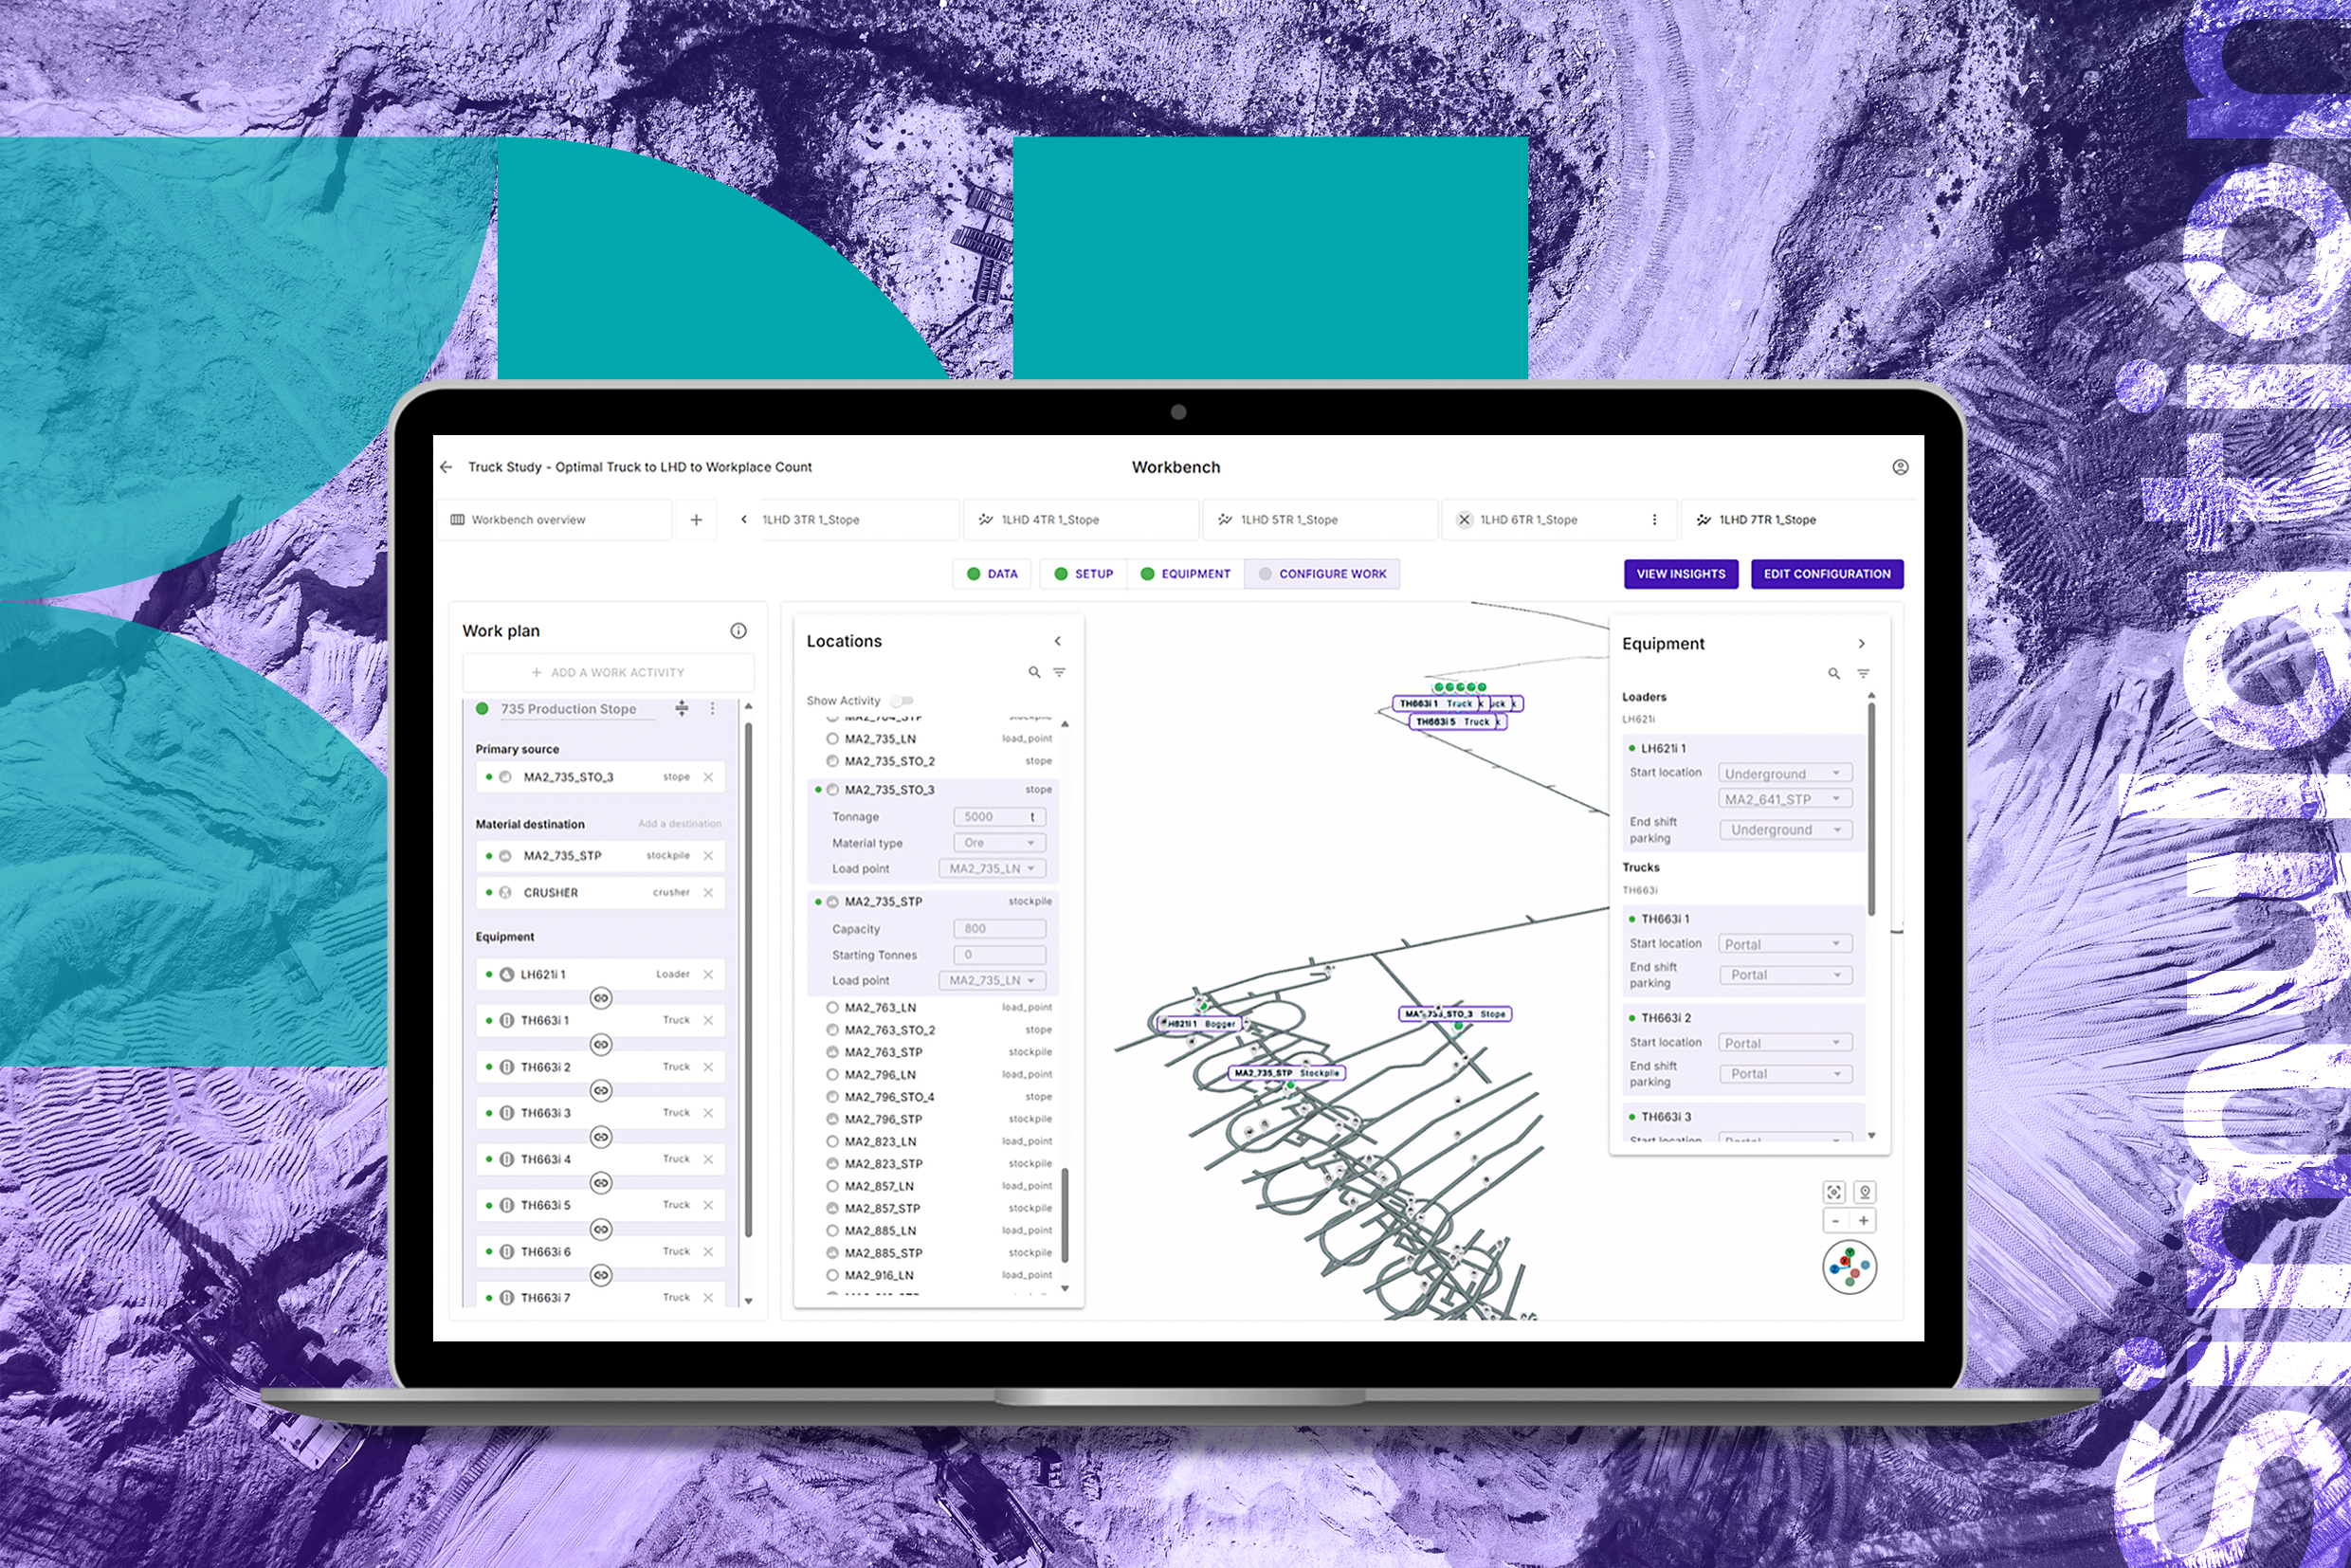
Improve Visibility of Material Flow Underground with idoba.sim

Demonstrating ROI for Underground Mining Simulation Software

idoba Wins Innovation Award in the 2025 Mining Technology Excellence Awards
Balancing Trade-Offs: Optimising Loader Productivity, Rehandle, and Delays
Balancing Trade-Offs: Optimising Load & Haul Underground

How Simulation Can Help Navigate ESG Challenges in Mining
Differences in Agent Based and Discrete Event Modelling
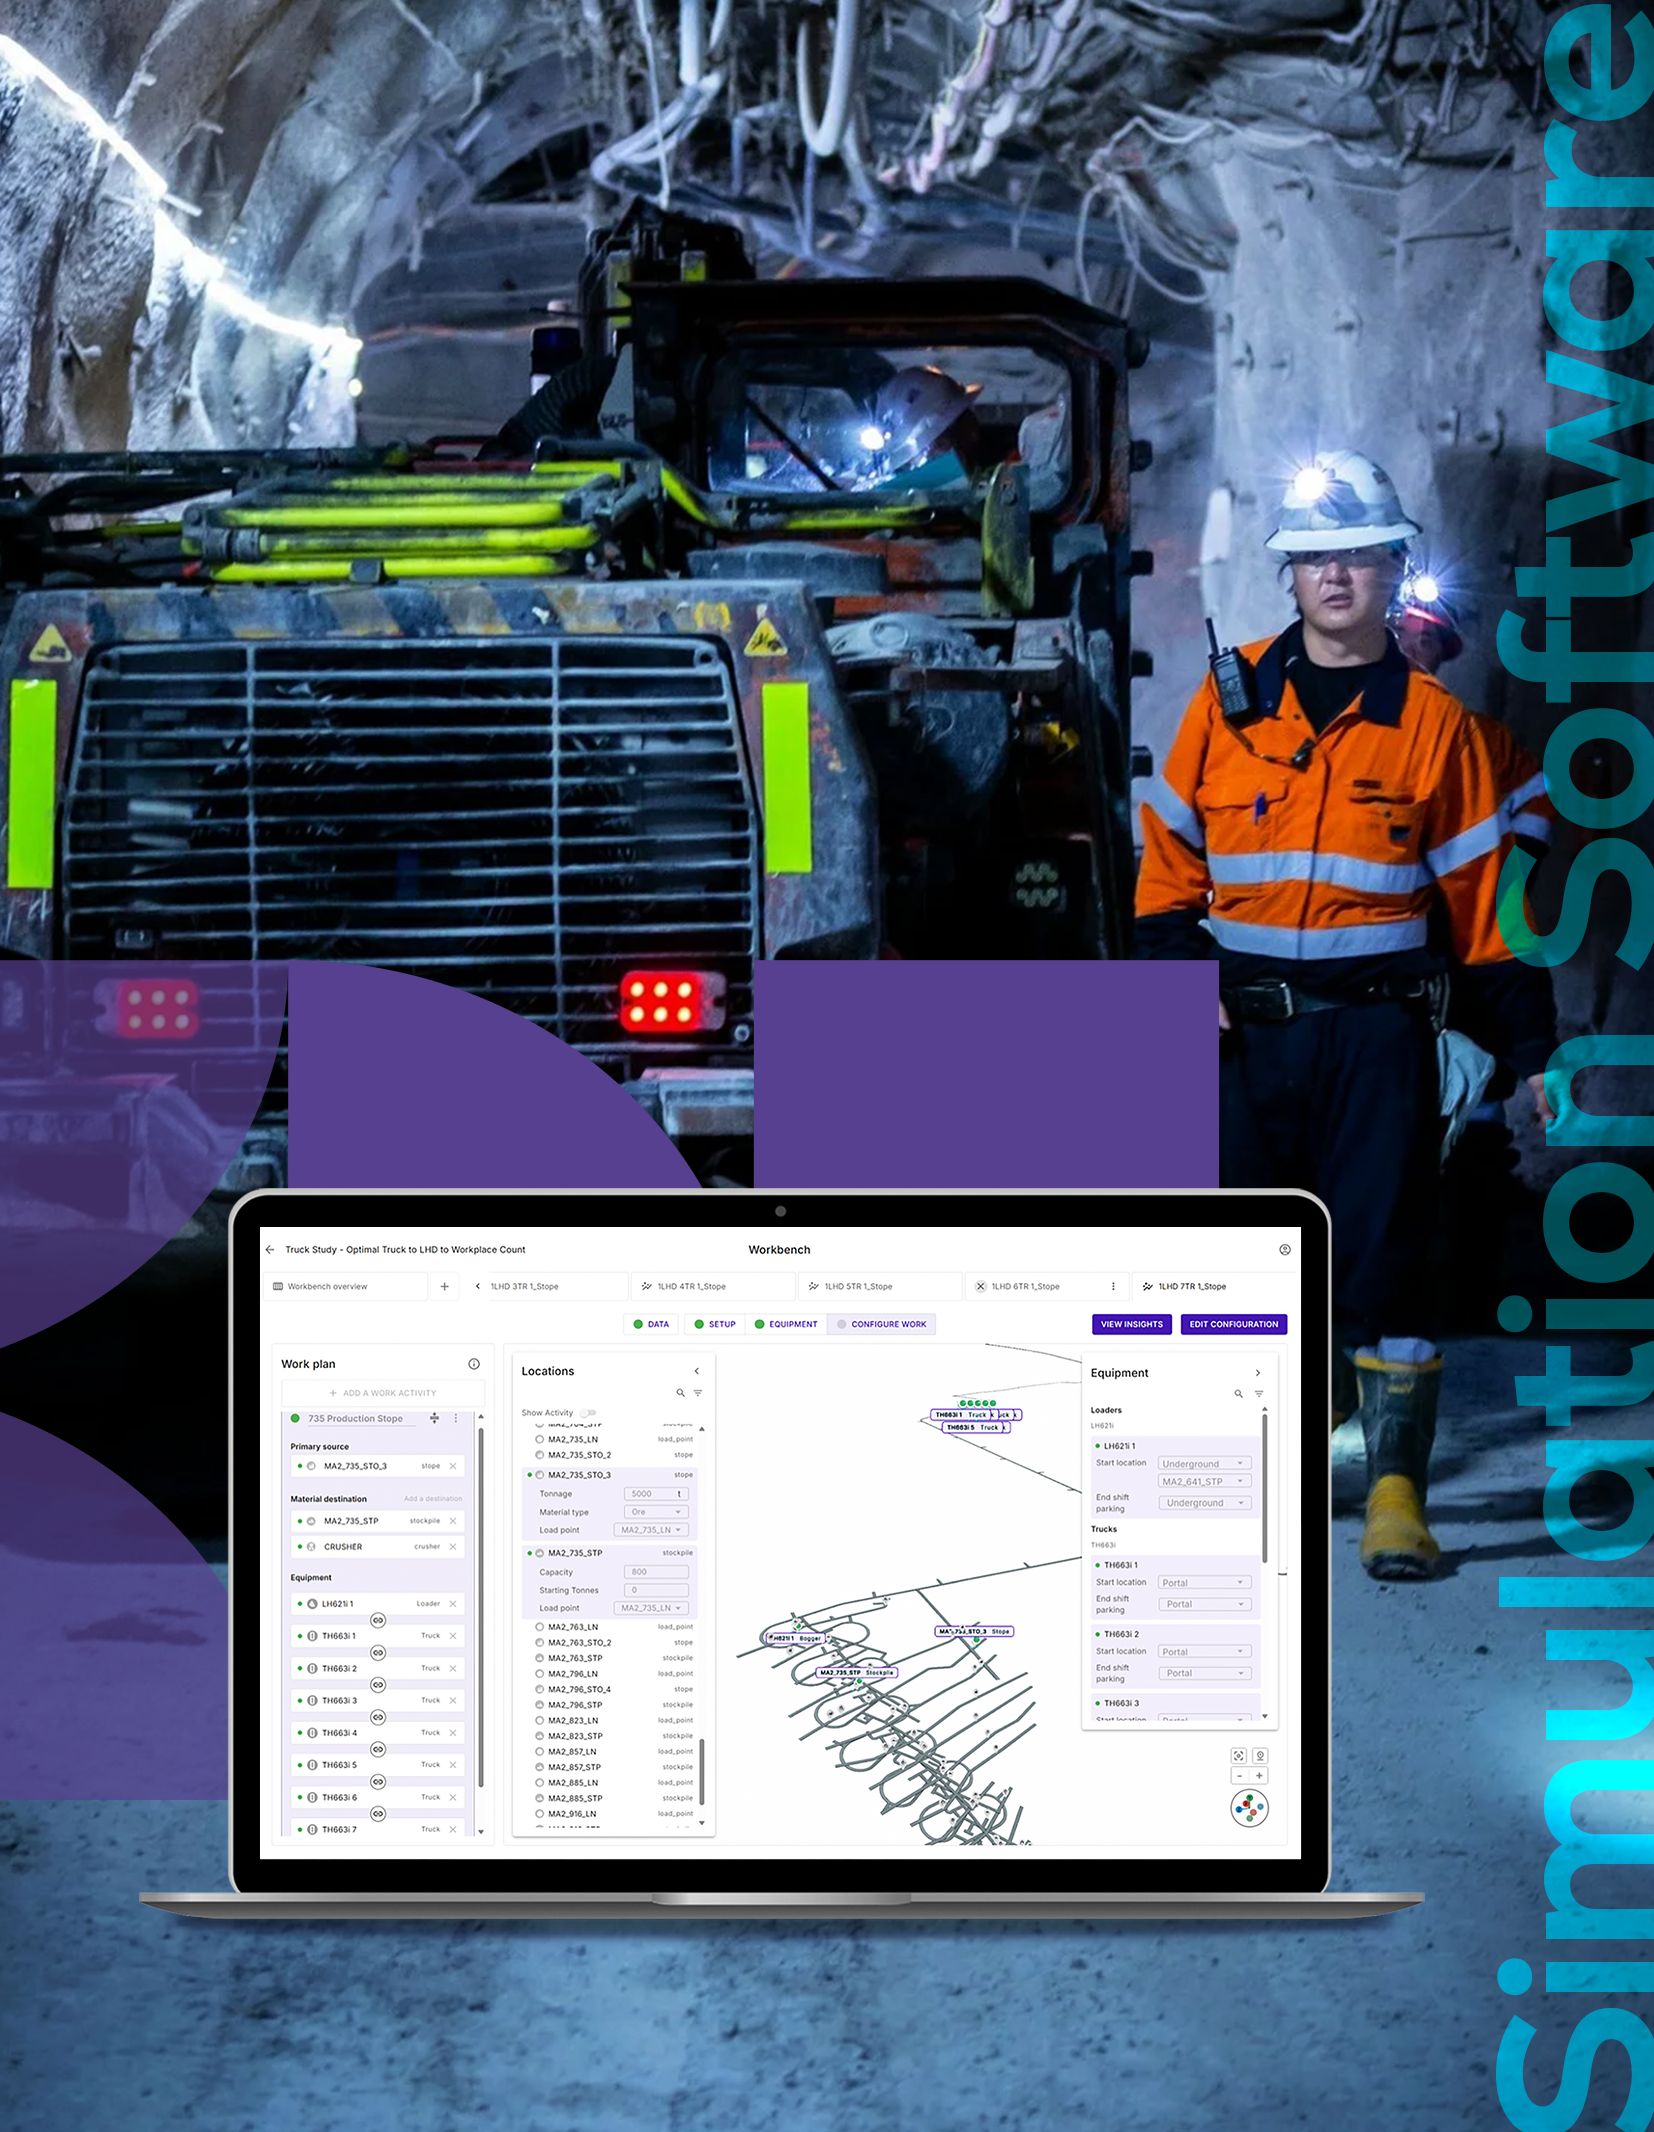
Driving Underground Mining Innovation With Simulation Software